Classes
Class 10 Math Basic Statistics
Change the way you learn with Maqsad's classes. Local examples, engaging animations, and instant video solutions keep you on your toes and make learning fun like never before!
Class 9Class 10First YearSecond Year

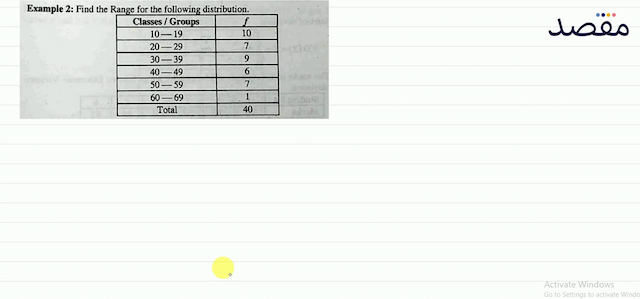
Example 2: Find the Range for the following distribution.\begin{tabular}{|c|c|}\hline Classes / Groups & \boldsymbol{f} \\\hline 10-19 & 10 \\\hline 20-29 & 7 \\\hline 30-39 & 9 \\\hline 40-49 & 6 \\\hline 50-59 & 7 \\\hline 60-69 & 1 \\\hline Total & 40 \\\hline\end{tabular}
Example 2: Find the Range for the following distribution.\begin{tabular}{|c|c|}\hline Classes / Groups & \boldsymbol{f} \\\hline 10-19 & 10 \\\hline 20-29 & 7 \\\hline 30-39 & 9 \\\hline 40-49 & 6 \\\hline 50-59 & 7 \\\hline 60-69 & 1 \\\hline Total & 40 \\\hline\end{tabular}
_Eg2.png&w=640&q=75)
